AirView - Realtime Traces
AirView - Frequency Range
across the frequency since the start of an AirView session. Average - shows the running average energy across frequency. Real-time -
shows the real-time energy seen by the AirView device as a function of frequency.
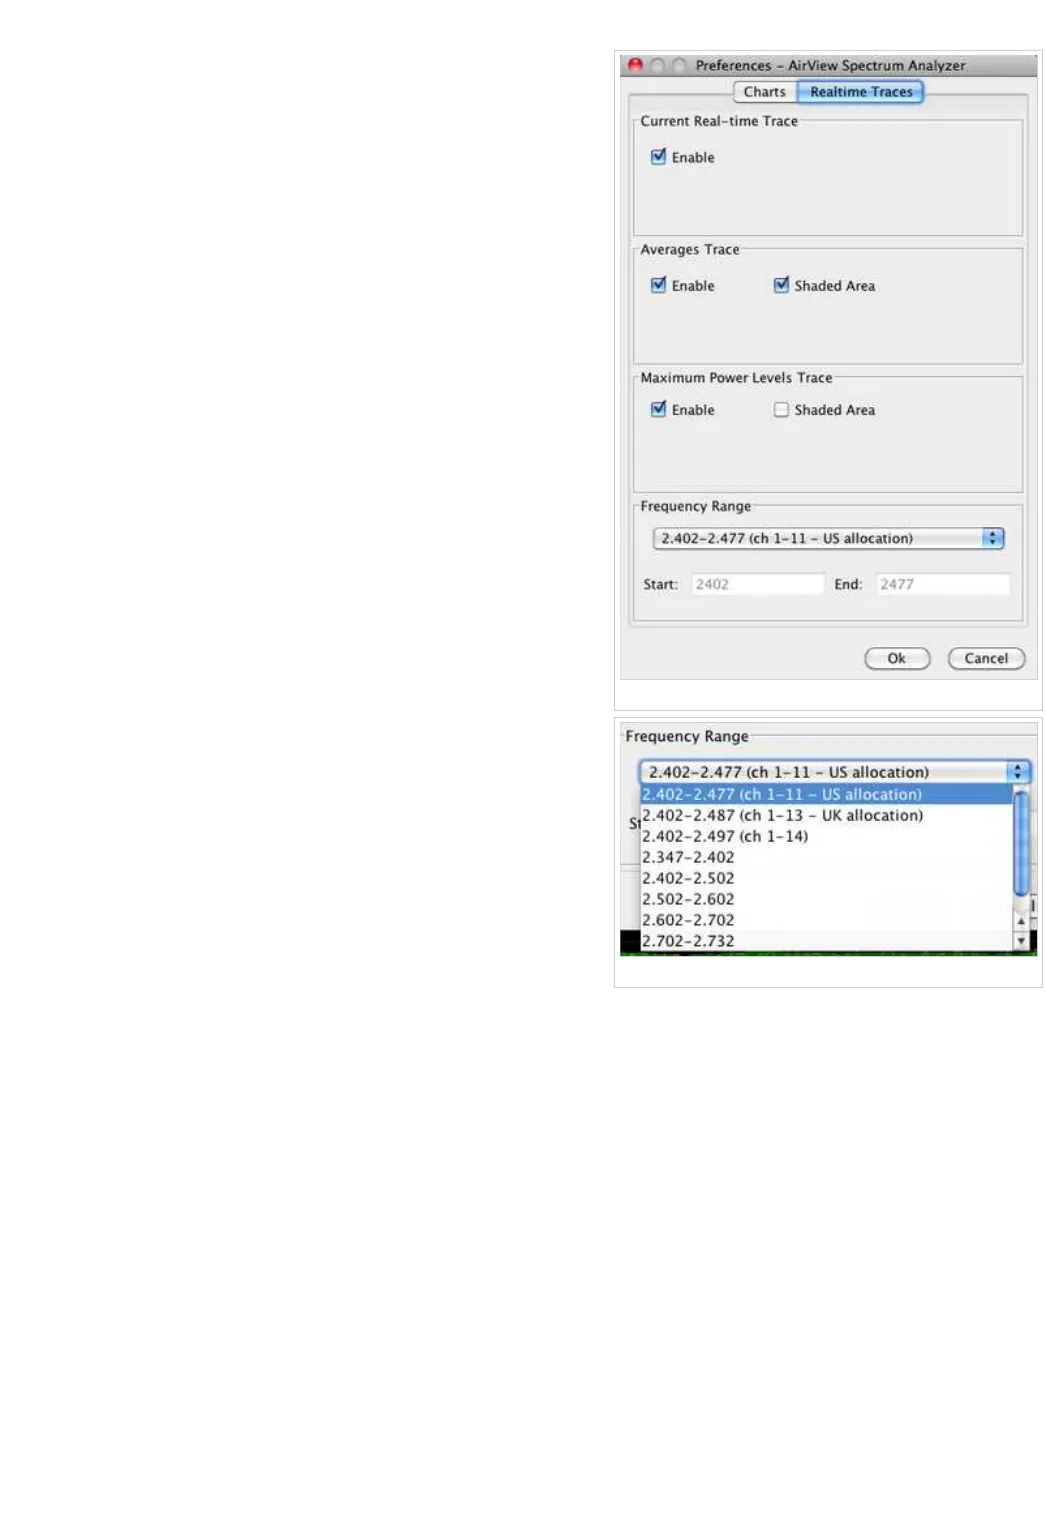
Realtime Traces
The following settings apply to the Real-time chart:
Current Real-time Trace: When the “enable” checkbox is checked the
real-time trace will be turned on. This trace is the yellow outline on the
chart, which represents real-time power level of each frequency. Its refresh
speed depends on the FPS.
Averages Trace: This is the green area on the third chart, which represents
the average received power level and considers data for as long as AirView
has been running. You may disable this graph by unchecking the “Enable”
checkbox. Or you may enable only a green outline, without the shaded area,
by unchecking the “Shaded Area” checkbox.
Maximum Power Trace: This is the blue area on the third chart, which
represents the maximum received power level and considers data for as long
as AirView has been running. You may disable this graph by unchecking the
“Enable” checkbox. Or you may enable only a blue outline, without the
shaded area, by unchecking the “Shaded Area” checkbox.
Frequency Range: here you can select the amplitude of the frequencies
interval to be scanned. There are some pre-defined ranges for the most
popular bands. However, you can specify a custom range according to your
needs.
[Content]
AirOS 5.3 - Ubiquiti Wiki
http://www.ubnt.com/wiki/AirOS_5.3
34 van 34 14-4-2011 21:46