KIP Cost Review Application
No part of this publication may be copied, reproduced or distributed in any form without express written permission
from KIP. 2012 KIP. vii_iv
- 6 -
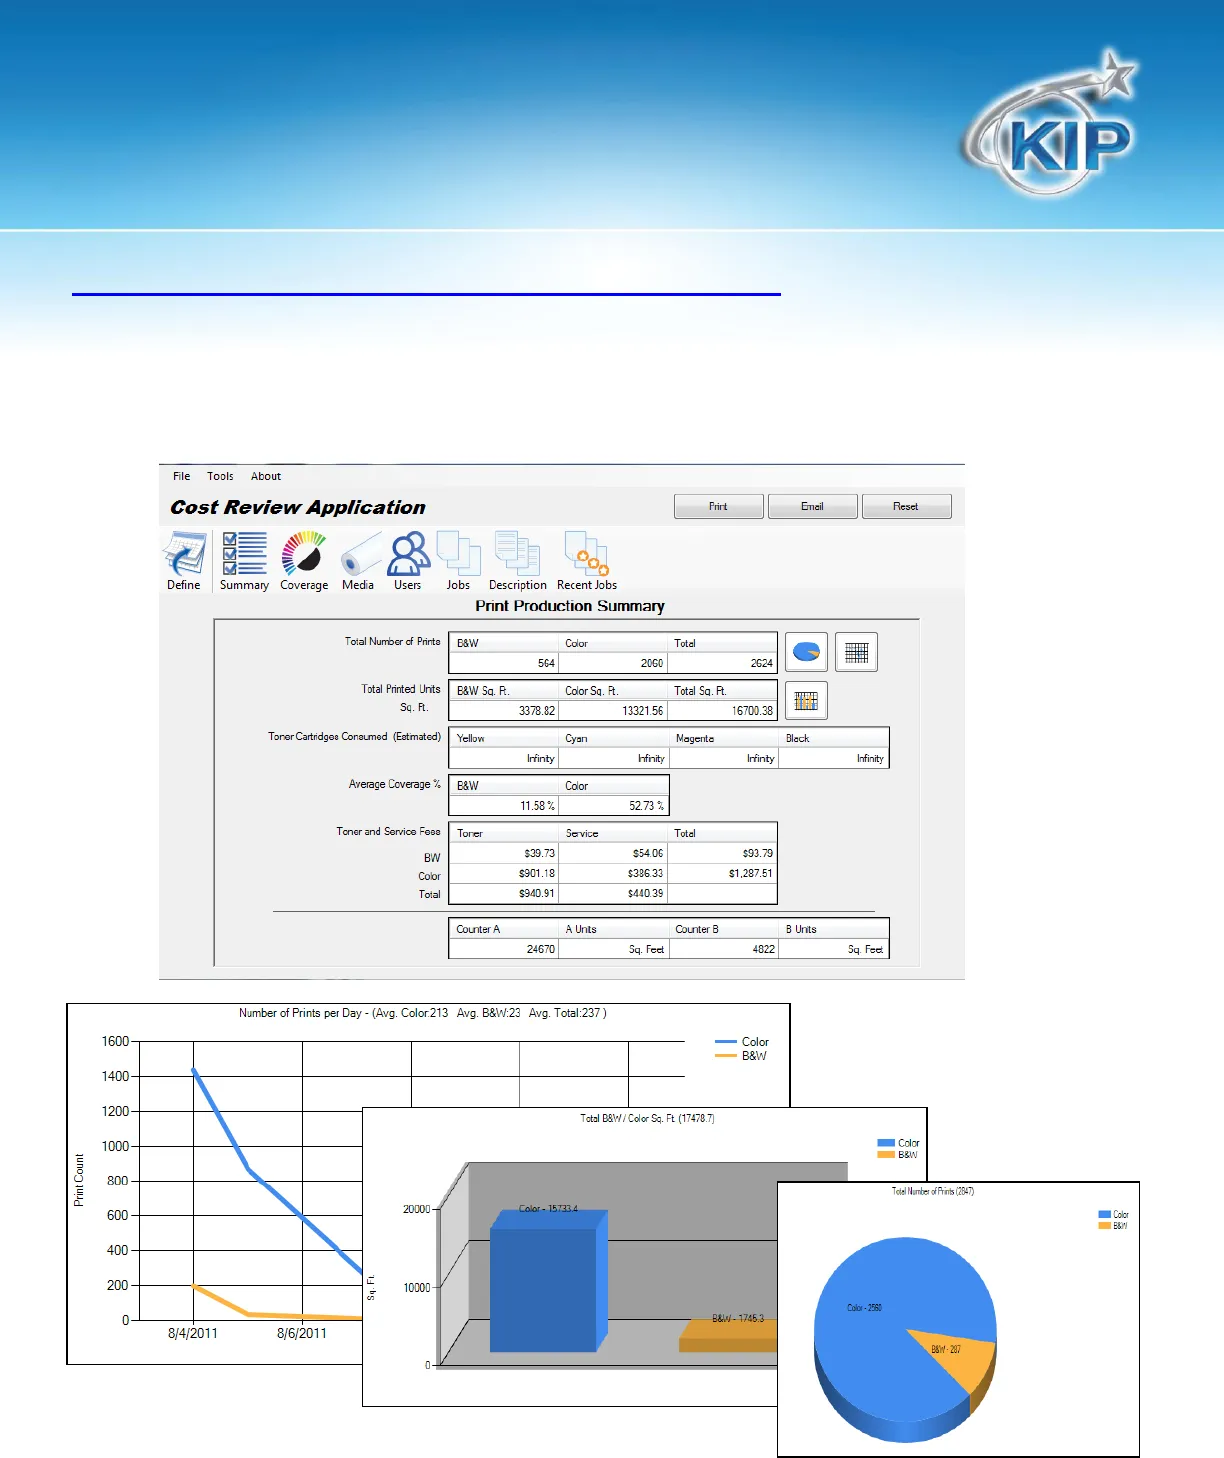
Production Print Summary and Graphic Charts
The Production Print Summary report contains information regarding the overall printing and toner usage of the
specified report. This report information is based on the Date Range provided on the Report Parameters menu.
The Total Counters at the bottom of the report cover all printing for the life of the printer. The chart buttons on
the right side allow for viewing charts that provide graphical information in the form of a Pie Chart for the Total
Number of prints (Color vs B&W), a Bar Chart for the Total Square Units (Color vs B&W), and Line Graph that
shows the Color vs. B&W printing over the range of the dates provided.