Trunk Performance report 7-74
Chapter 7: Running Contact Center Reports
Wave Contact Center Administrator Guide
Reading the Trunk Performance report
Report tab
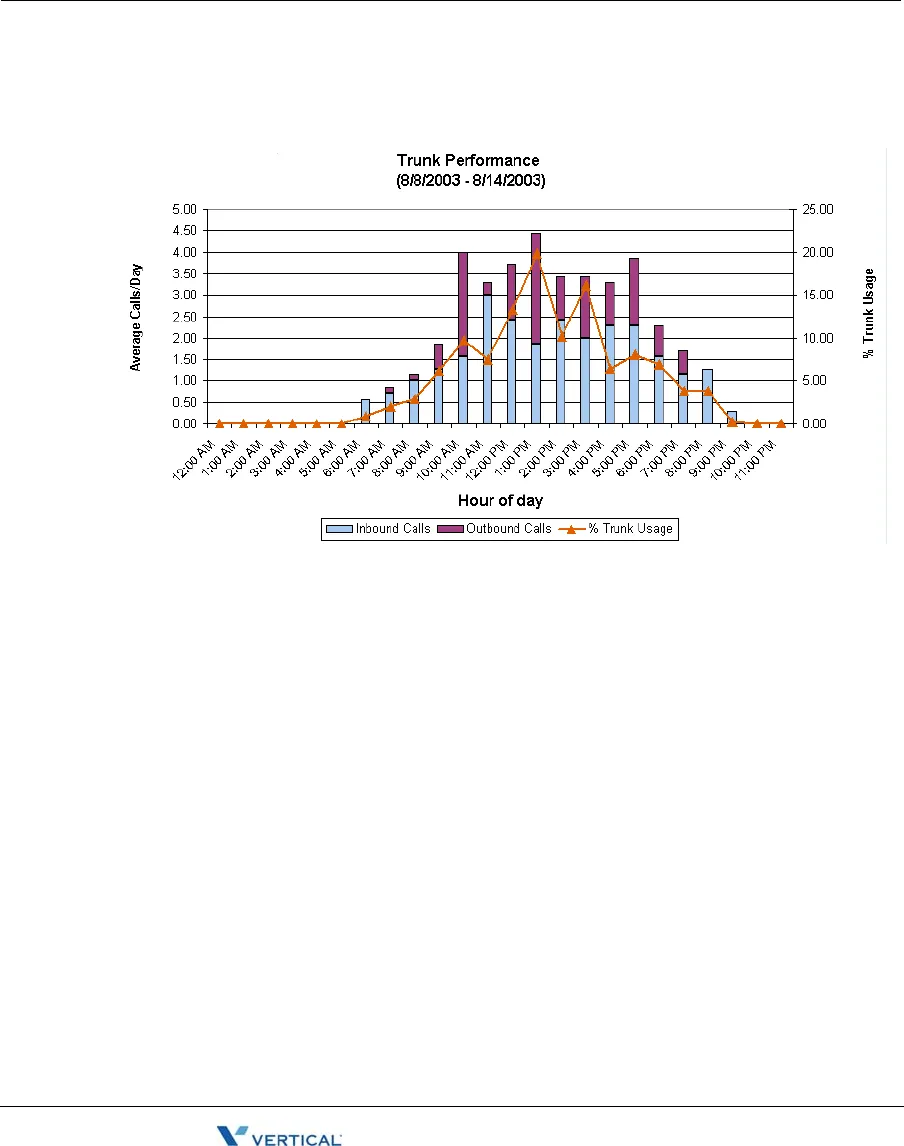
The Report tab displays the following information in a stacked bar chart:
•
Hour of Day. Each hour in the day is labeled along the x-axis of the report.
•
Average Calls/Day. Total number of calls per interval. Inbound Calls and Outbound Calls
are displayed as stacked bars, and read against the left y-axis of the report.
•
% Trunk Usage. Percentage of trunk usage per interval. Displayed as a line, and read
against the right y-axis of the report.
Data tab
The following fields appear on the Data tab of this report:
•
Busiest Hour. The hour of the day that had the most trunks in use based on the CCS
calculation (see
CCS, below).
•
CCS. 100 call-seconds. One call-second is equivalent to 1 call that was 1 second long.
Release 2.0 Service Pack 1