A: Experiment Tutorials
176 000-20000-300-02- 201110
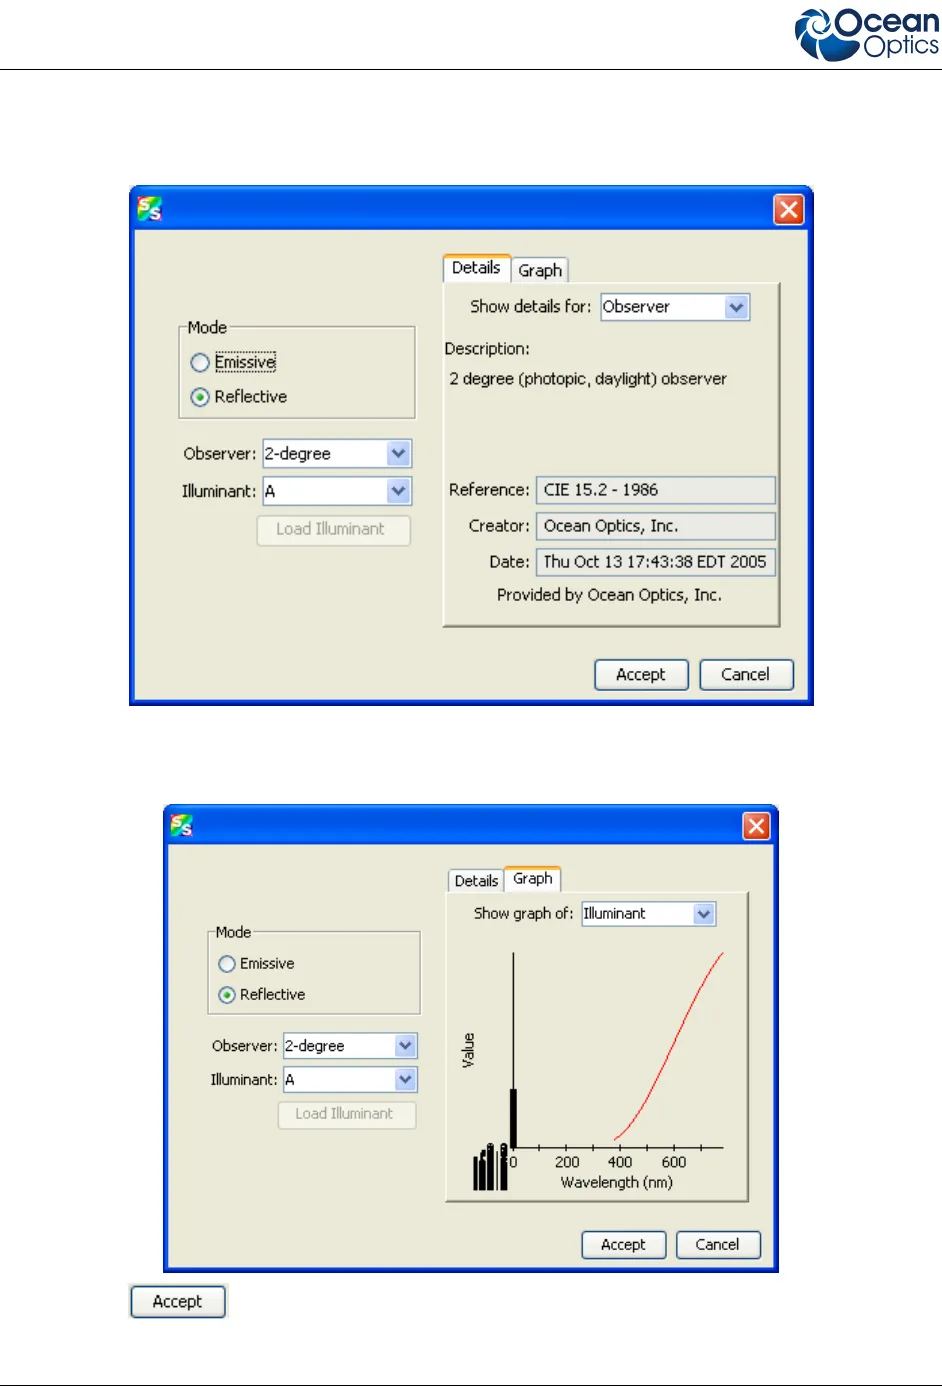
9. Your selections are reflected on the right side of the screen. Select to view either illuminant or
observer details in the
Show details for field. An example screen with details for the observer is
shown below:
10. Select the Graph tab to view a graph reflecting the selections you have chosen. An example graph
of the illuminant is shown below:
11. Click . Your color data appears on the main SpectraSuite screen as shown below: