10.2.2 Chart Panel
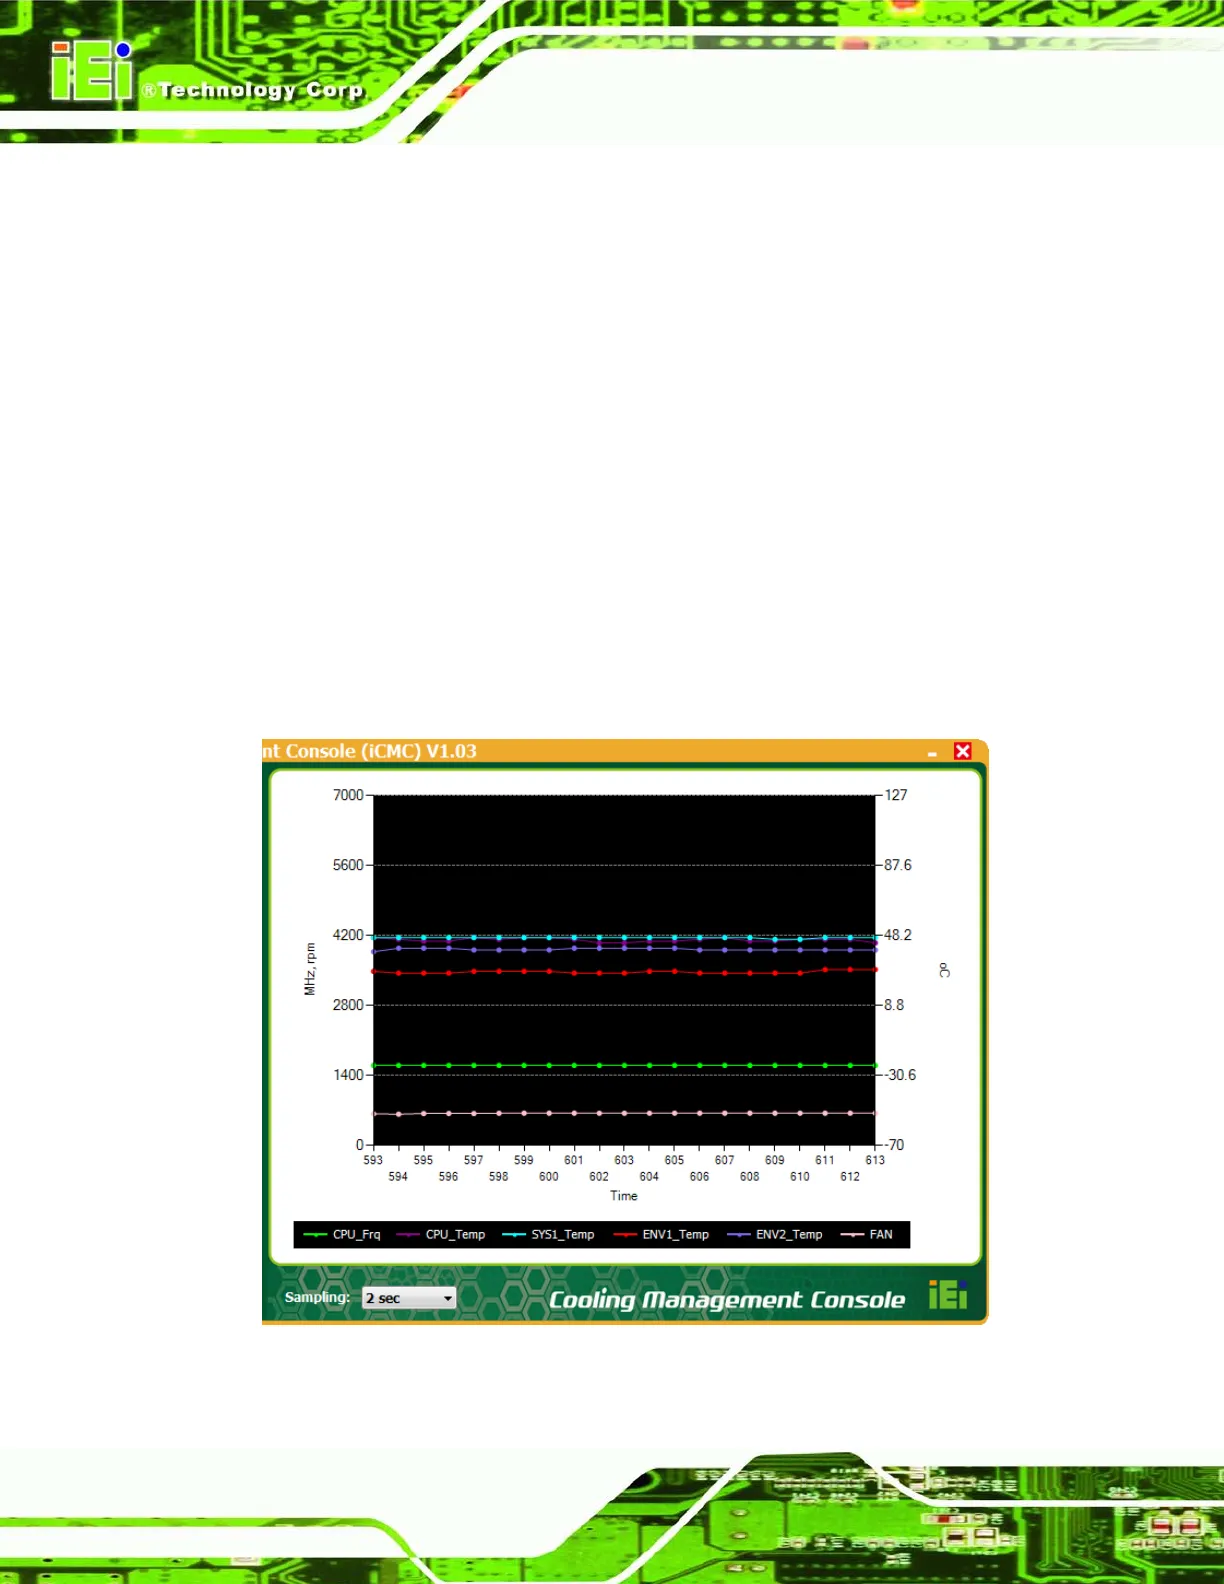
Figure 10-9 shows the chart panel interface. The line chart is used to visualize the system
data listed in the information panel. The following information is displayed in different color
lines:
Green: CPU frequency
Pink: CPU temperature
Blue: System temperature
Yellow: Environment temperature 1
Red: Environment temperature 2
Purple: Fan speed
The y-axis on the left represents the values for CPU frequency (MHz) and fan speed
(RPM) while the y-axis on the right represents the values for CPU, system and
environment temperatures.
Figure 10-9: iCMC – Chart Panel